The need for reliably detecting reciprocating compressor cylinder leaks is important because this gives an indication of excessive wear or damage of a consumable component, such as the valves (which account for the majority of maintenance), piston rings and packing. A cylinder leak not only reduces the compressor efficiency, but can also result in uneven loading on the crosshead (rod reversal), high discharge gas temperature and a stressed rod. PV plots are often used to determine cylinder leaks but it requires specialists to manually analyze them. The polytropic exponent function, on the other hand, provides automatic monitoring capability without requiring much specialist expertise.
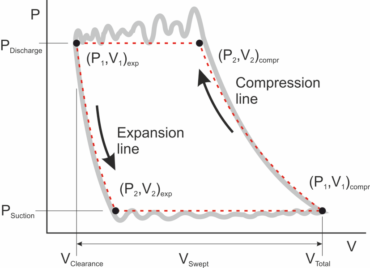
In summary, a PV plot consists of the measured dynamic pressure values, which are plotted against the corresponding calculated volume values, as shown in Figure 1. It is only the expansion and compression lines of a PV plot that are used for detecting cylinder leaks. Indication of a leak occurs when these lines deviate from the corresponding lines in the theoretical PV plot, which is also shown in Figure 1.

Figure 1. Theoretical PV plot (red) overlying a PV plot based on actual measurements (gray).
The theoretical PV plot is based on the thermodynamic polytropic process, which describes the work/heat transfer process for gas compression and expansion, as shown in Equation (1).

Where:
P = Pressure
V = Volume
n = Polytropic exponent
This equation can then be extended to cover other points along the compression or expansion line:

Equation (2) can then be solved for the polytropic exponent n as follows:

The polytropic exponent function shown in Equation (3) uses the actual measured pressure and corresponding volume values to calculate the n. This value is constant and is directly related to the properties of the gas. The polytropic exponent function can be seen as the expansion and compression lines portion of the PV plot that have been converted into a scalar value. It can thus be automatically monitored to alarm limits and it is not so sensitive to installation errors like the PV plot is, since only relative changes are monitored, not absolute values.
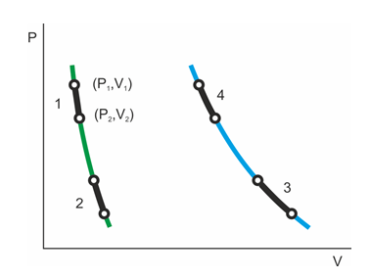
Any portion of the expansion and compression process can be monitored for the polytropic exponent, but in practice this is done on two segments for each line, as shown in Figure 2. This is because for a piston ring leak, the upper part of the compression curve (and possibly the expansion curve) will have different values for the exponent calculations compared to the lower part.

Figure 2. Example of locations for calculating four n values (segments). The P and V values for segment 1 are indicated. (Green is the expansion line, blue is the compression line.)

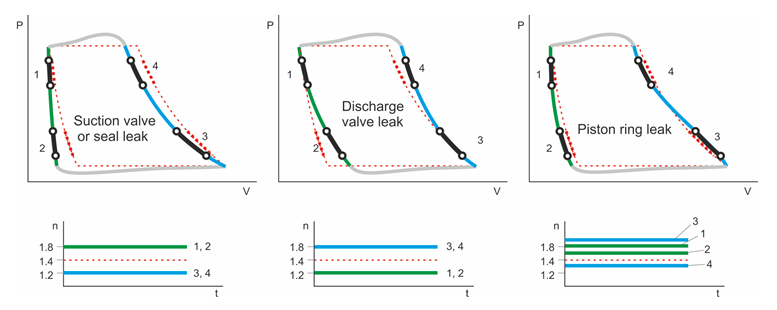
Figure 3. Above: Examples of detecting cylinder leaks using the four calculated polytropic n values. Below: Examples of n trends for each leak condition indicated above. The theoretical PV plot is shown in red, where n = 1.4, as an example.
The individually calculated polytropic exponent n values should be identical to the n value of the gas, which is the same value used for calculating the theoretical PV plot. If there is a difference, as shown in the bottom of Figure 3, this will indicate a leak in a specific part of the cylinder.
The n values can be automatically monitored to alarm limits but there are some important considerations. The polytropic exponent function will not be accurate, as for the theoretical PV plot, if the n value of the gas is not known at all times. If there are pressure pulsations on one or more of the n segments, this could give inaccurate results, so the segments should be positioned to avoid this. Please also keep in mind that the polytropic exponent function is not intended to replace the PV plot, it only compliments it. This is partly because the PV plot has important information on the suction and discharge processes.


In what way does the power requirement change due to discharge or suction valve leakage?
More power of course will be required to compress the same capacity of gas, but normally there is not much of a change in the power if there is a valve leak. Therefore the power measurement is not used to give an early warning indication of a valve leak. This is because if you look at the PV plot of a leaking suction or discharge valve, the total area of the plot (i.e. the compression/expansion work) will not be much different than that from the normal PV plot.Although the area of the plot does not give an early detection of… Read more »