Both Electrical and Current Signature Analysis (ESA/MCSA) can be used to evaluate conditions of a system and assist in preemptively mitigating defects while optimizing system efficiency based on their specific functions. In the case of this article we will focus on a simple single-phase MCSA tester and a fan system with a variable frequency drive that had a synchronous belt installed (Figure 1). While most technologies focus on how soon faults and defects are detected, the system and energy analysis capability of ESA and MCSA can be used to identify future degradation issues before they occur. The motor is a 60 HP, 1785 RPM, 72 Amp electric motor.
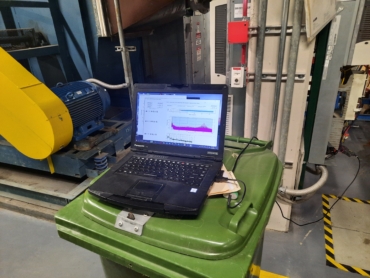
Figure 1: MCSA testing of a Fan and VFD for Operational Optimization
A synchronous belt (Figures 2 and 3) removes any slip from the system and results in an efficiency of approximately 98% versus 92-95% for a cogged belt and 88-93% for a standard v-belt. When installed correctly these systems will often pay for themselves over a few months. However, when installed incorrectly, can result in damage to bearings and belt teeth. In this case study we will show how MCSA can be used to make improvements to the system by reviewing conditions as VFD settings are modified. While additional items need to be addressed to reduce equipment overload due to overspeed from incorrect sheave diameter selection, the focus at this point is stopping mechanical damage while the application is reviewed.
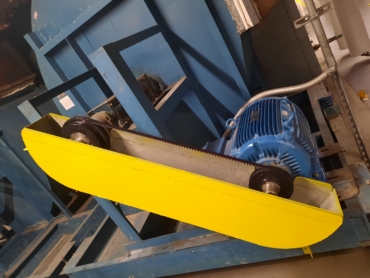
Figure 2: Synchronous belt system.
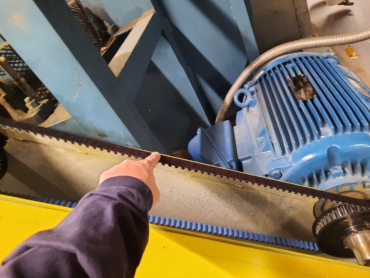
Figure 3: Synchronous belt and sheave – similar to a ‘timing belt.’
Inrush and operational data was collected from a single phase from the VFD and current values compared to the drive display (Figure 4). The drive also went into overcurrent warning tripping only once as the overcurrent trip was set very high. Following the initial data collection changes were made to the drive including a change in startup/coast down times from 90 seconds to 120 seconds and linear to S-curve, which reduces the shock loads on the belt and bearings.
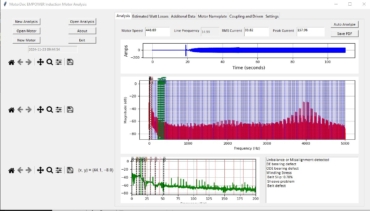
Figure 4: Inrush test with EMPOWER MCSA system and analytics.
The energy impacts before and after are found in Figures 5 and 6 related to the inrush. Note that the losses are reduced due to lower starting stresses in the bearings and components.
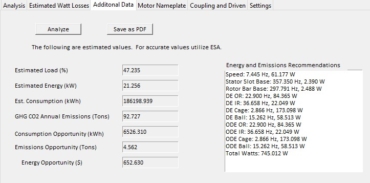
Figure 5: Component losses during inrush analysis before VFD changes.
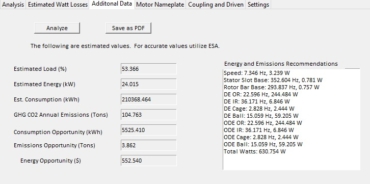
Figure 6: Component losses during inrush analysis after VFD changes.
Even with a slightly higher load after settings changes, the overall component losses are decreased, even with bearing defects due to lubrication and some damage to the DE outer race.
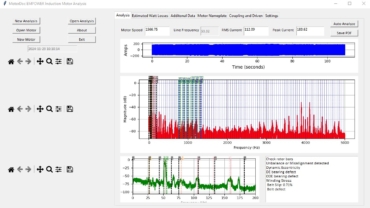
Figure 7: Normal operation following startup and dampers open.
Figure 7 identifies a few conditions that continue to exist following the VFD modifications including overloading even with reduced voltage as shown on the VFD. The gain was also changed which provided some buffer to speed changes, which are rapid in this application which is to maintain static pressure.
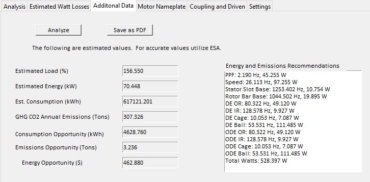
Figure 8: Component losses in high overload conditions. High ball losses in DE and ODE indicate lubrication issues in the installed sealed bearings.
The losses (Figure 8) also appear to be higher than they should be and are also based on speed. At constant speeds bearing losses, with the exceptions of changes in belt loading, would remain relatively constant. It is important to note that the fan originally operated at ~1200 RPM with the motor at 55 Hz and is now at ~1375 RPM due to sheave size changes. The horsepower requirement changes by the cube of speed changes, so the higher fan speed impacts the load and the PID loop had not been modified to the sheave dimension changes.
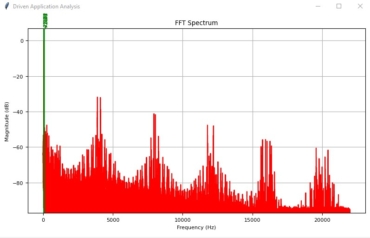
Figure 9: VFD output Supra-Harmonics as defined by IEC Std 61000-4-30: 2021 Annex C.
Finally, as shown in Figure 9, high order harmonics exist in the system as multiples of the VFD carrier frequency. In this case, 4 kHz, 8 kHz, 12 kHz, 16 kHz and 20 kHz harmonics with sidebands exist at high levels compared to the operating current. These frequencies impact motor core heating (Figure 10) and shaft heating and currents (Figure 11). As conditions are showing component degradation the application should consider the application of filters between the motor and drive. High values of these Supra-Harmonics (re: IEC Std 61000-4-30: 2021 Annex C) can also prevent proper operation of shaft brushes and discharges across bearings.
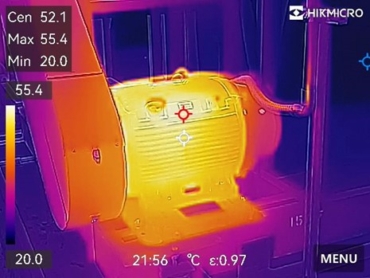
Figure 10: Surface temperature (55.4 C) of motor after 10 minutes at ~50Hz in degrees C.
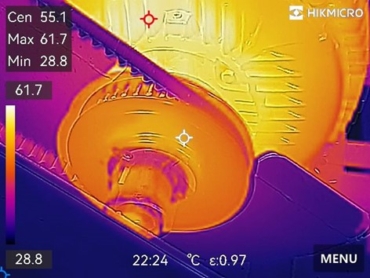
Figure 11: Sheave and bearing housing temperatures 15 minutes after stopping the motor in degrees C. 55 C sheave and 61.7 C bearing.
In conclusion, the use of MCSA and ESA technologies can be used to identify potential conditions well in advance of them becoming defects in addition to the defects. This allows for proper optimization of the system to avoid future issues in order to take full advantage of energy and reliability improvements.


